Roots: What are the Odds?
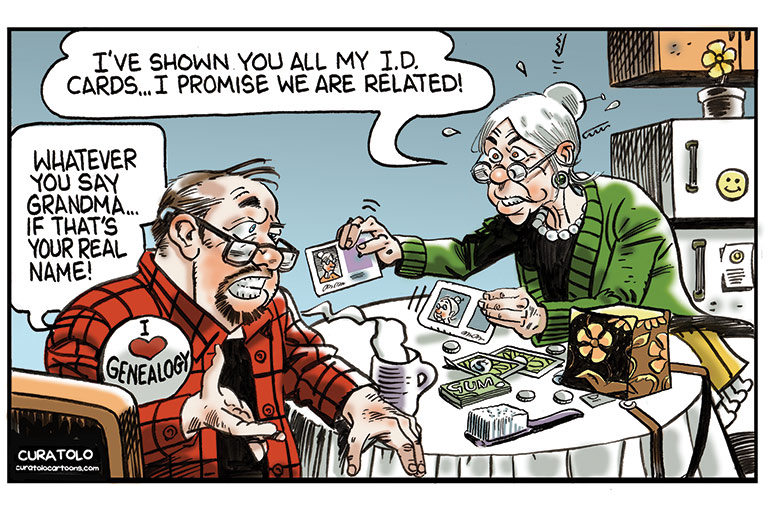
Talk to genealogists about statistics, and you’ll often draw a blank. “My grandfather was either my grandfather or he wasn’t. It doesn’t make sense to say there’s a seventy-five per cent probability that he was.” Such a shame. Why not find ancestors using the same statistical tools that guide explorers seeking wreckage on the ocean floor or that allow meteorologists to predict the trajectory of the jet stream a month hence?
Consider this case from the files of Toronto genealogist Linda Reid. It features two lines of descent from documented siblings. Surprisingly, living representatives of the two lines share no DNA. Other research has winnowed explanations of this anomaly down to two main possibilities: an adoption in one line or unexpected paternity in the other. Which is it? Are the odds equal?
Using reasonable estimates for adoption and false paternity, it turns out that there’s about an eighty per cent chance that there was an adoption in the first line and a thirty per cent chance of false paternity in the second. Note that the total is greater than one hundred per cent — both explanations could be true! Other factors being equal, Linda is more likely to get a return on her research time and effort if she searches initially for evidence of the adoption.
One objection raised by genealogical old-timers is that common sense will suffice in these situations. Well, no. When presented with the question as to which of Linda’s hypotheses was the more probable, a roomful of expert genealogists could not agree.
Others suggest that we don’t need numbers; words will suffice. The problem is that non-quantitative language means different things to different people. Ask what “almost certain” means as a percentage. Even a genealogist who has no use for statistics will know that a proposition with a one per cent chance of being wrong is vastly different from an alternative that will be wide of the mark one time in four.
The naysayers also claim that we can’t know the numbers, anyway — and sometimes they’re right. But there are plenty of demographical statistics we can know or can reasonably estimate: including population, the incidence of specific names and naming patterns, and the approximate frequency of life events. Using such benchmarks along with mathematical tools known since the eighteenth century, we often derive probabilities that are surprisingly instructive.
Take the example of my friend Peter MacDonald of Toronto. He had developed a well-researched, well-argued case that he was descended from a William Macdonald born in Quebec City in 1821. The key step was the conjecture that an infant Alexander Macdonald recorded in Quebec birth records was the same person as an adult Alexander Macdonald living decades later in Putnam, Connecticut. Peter had marshalled several pieces of evidence in favour of this identification: dates, locations, naming patterns. How persuasive was the claim? Genealogists face this conundrum all the time – they’ve done the research and have a strong hypothesis, but how strong is it? The absence of evidence for a better explanation is not evidence of absence, especially if the documentary record is spotty.
Using every available finding iteratively and estimating its likelihood based on prevailing population norms — first if the conjecture were true, then if it were untrue — we were amazed to calculate that the odds were ninety-nine per cent in favour of the correctness of Peter’s proposition.
We reran the math many times using different reasonable estimates and different framings of the problem, but the conclusion was always the same. (Peter has since discovered additional documents that have moved the needle to more than 99.99 per cent.)
Back to “seventy-five per cent” grandpa. It’s helpful to think of probability not as a statement about the old fella but about your state of mind. You’re seventy-five per cent sure you have the right guy, but significant doubt remains.
As genealogists we want to drive that uncertainty as close to zero as we can. Much as math-phobics may not like it, the judicious and careful use of statistics can help us quantify our uncertainty and prioritize the research that’s most likely to reduce it.
Advertisement
We hope you’ll help us continue to share fascinating stories about Canada’s past by making a donation to Canada’s History Society today.
We highlight our nation’s diverse past by telling stories that illuminate the people, places, and events that unite us as Canadians, and by making those stories accessible to everyone through our free online content.
We are a registered charity that depends on contributions from readers like you to share inspiring and informative stories with students and citizens of all ages — award-winning stories written by Canada’s top historians, authors, journalists, and history enthusiasts.
Any amount helps, or better yet, start a monthly donation today. Your support makes all the difference. Thank you!
Themes associated with this article
Advertisement
You might also like...
With 7 uniquely curated newsletters to choose from, we have something for everyone.
Save as much as 40% off the cover price! 4 issues per year as low as $29.95. Available in print and digital. Tariff-exempt!

